Ever wondered why your server crashes or your app slows down? A solid system monitor is the silent guardian of your digital ecosystem, keeping everything running smoothly behind the scenes.


What Is a System Monitor and Why It Matters
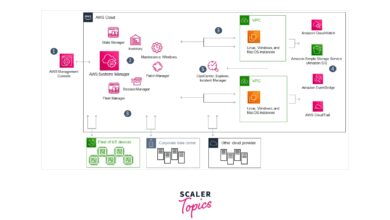
A system monitor is a software tool designed to track, analyze, and report on the performance and health of computer systems, networks, and applications. It acts as a digital watchdog, continuously observing key metrics like CPU usage, memory consumption, disk I/O, network traffic, and application responsiveness. Without a reliable system monitor, IT teams are essentially flying blind—unable to detect issues before they escalate into outages or performance bottlenecks.
Core Functions of a System Monitor
The primary role of a system monitor is proactive detection. Instead of waiting for users to report slow response times or downtime, a system monitor identifies anomalies in real time. This includes tracking resource utilization across servers, virtual machines, containers, and cloud instances. For example, if a database server’s CPU usage spikes to 95% for more than five minutes, the system monitor can trigger an alert, allowing administrators to investigate before service degradation occurs.
- Real-time performance tracking
- Automated alerting and notifications
- Historical data logging for trend analysis
According to Red Hat, effective system monitoring is foundational to maintaining uptime, security, and compliance in modern IT environments.
Types of System Monitoring
Not all monitoring is the same. System monitors can be categorized based on what they observe. Infrastructure monitoring focuses on hardware and OS-level metrics. Application performance monitoring (APM) dives deeper into code-level performance, such as transaction traces and error rates. Network monitoring tracks bandwidth, latency, and packet loss. Then there’s log monitoring, which analyzes text-based logs from applications and systems to detect errors or security threats.
“Monitoring is not about collecting data—it’s about making data actionable.” — Charity Majors, CTO of Honeycomb
Each type plays a crucial role, but the most powerful system monitor integrates all these layers into a unified observability platform.
Top 7 System Monitor Tools You Should Know
The market is flooded with monitoring solutions, but only a few stand out for their reliability, scalability, and ease of use. Below is a curated list of the top seven system monitor tools that have proven their worth across industries.
1. Nagios XI
Nagios XI is one of the most established names in system monitoring. Known for its robustness and flexibility, it supports monitoring of servers, switches, applications, and services. It uses a plugin-based architecture, allowing users to extend functionality easily. With Nagios XI, you can monitor everything from HTTP response times to disk space usage across thousands of nodes.
- Highly customizable dashboards
- Extensive plugin ecosystem
- Enterprise-grade alerting and reporting
Learn more at Nagios Official Site.
2. Zabbix
Zabbix is an open-source system monitor that offers real-time monitoring of networks, servers, and cloud services. It excels in scalability, capable of handling hundreds of thousands of metrics from thousands of devices. Zabbix uses a server-agent model, where agents collect data and send it to a central server for analysis and visualization.
- Auto-discovery of network devices
- Powerful trigger and alerting engine
- Supports SNMP, IPMI, JMX, and custom scripts
Zabbix is ideal for organizations that need a cost-effective yet powerful monitoring solution. More details at Zabbix.com.
3. Datadog
Datadog is a cloud-based system monitor designed for modern DevOps teams. It provides full-stack visibility, from infrastructure to applications, logs, and user experience. One of its standout features is its seamless integration with AWS, Azure, Google Cloud, Kubernetes, and hundreds of third-party services.
- Real-time dashboards with drag-and-drop widgets
- AI-powered anomaly detection
- Collaboration tools like shared screens and comment threads
Datadog’s strength lies in its ease of setup and rich visualization. Visit Datadog’s website to explore its capabilities.
4. Prometheus
Prometheus is an open-source systems monitoring and alerting toolkit originally built at SoundCloud. It’s now a graduated project of the Cloud Native Computing Foundation (CNCF). Prometheus specializes in monitoring dynamic, containerized environments, making it a favorite among Kubernetes users.
- Pull-based metrics collection
- Powerful query language (PromQL)
- Highly scalable and fault-tolerant
Prometheus stores time-series data efficiently and allows for complex queries to detect trends and anomalies. Check it out at Prometheus.io.
5. Grafana
While Grafana isn’t a monitoring tool by itself, it’s often paired with system monitors like Prometheus, Zabbix, or InfluxDB to visualize metrics. Grafana’s strength is its beautiful, customizable dashboards that turn raw data into actionable insights.
- Supports over 50 data sources
- Real-time graphing and alerting
- Extensive plugin ecosystem
Many consider Grafana the gold standard for data visualization in system monitoring. Learn more at Grafana.com.
6. SolarWinds Server & Application Monitor (SAM)
SolarWinds SAM is a comprehensive system monitor tailored for enterprise environments. It offers deep application performance insights, dependency mapping, and automated root cause analysis. It’s particularly strong in monitoring Microsoft environments like SQL Server, Active Directory, and Exchange.
- Pre-built templates for common applications
- Application dependency mapping
- Capacity planning and forecasting
SolarWinds is known for its user-friendly interface and powerful reporting. Explore it at SolarWinds.com.
7. New Relic
New Relic is a full-stack observability platform that combines infrastructure monitoring, APM, browser monitoring, and synthetic monitoring. It’s designed for developers and operations teams who want a unified view of their entire tech stack.
- Distributed tracing for microservices
- Real-user monitoring (RUM)
- AI-driven insights and recommendations
New Relic’s intuitive UI and powerful analytics make it a top choice for modern cloud-native applications. Visit NewRelic.com for more.
Key Metrics Tracked by a System Monitor
To be effective, a system monitor must track the right metrics. These metrics provide insight into system health, performance, and potential risks. Let’s break down the most critical ones.
CPU and Memory Usage
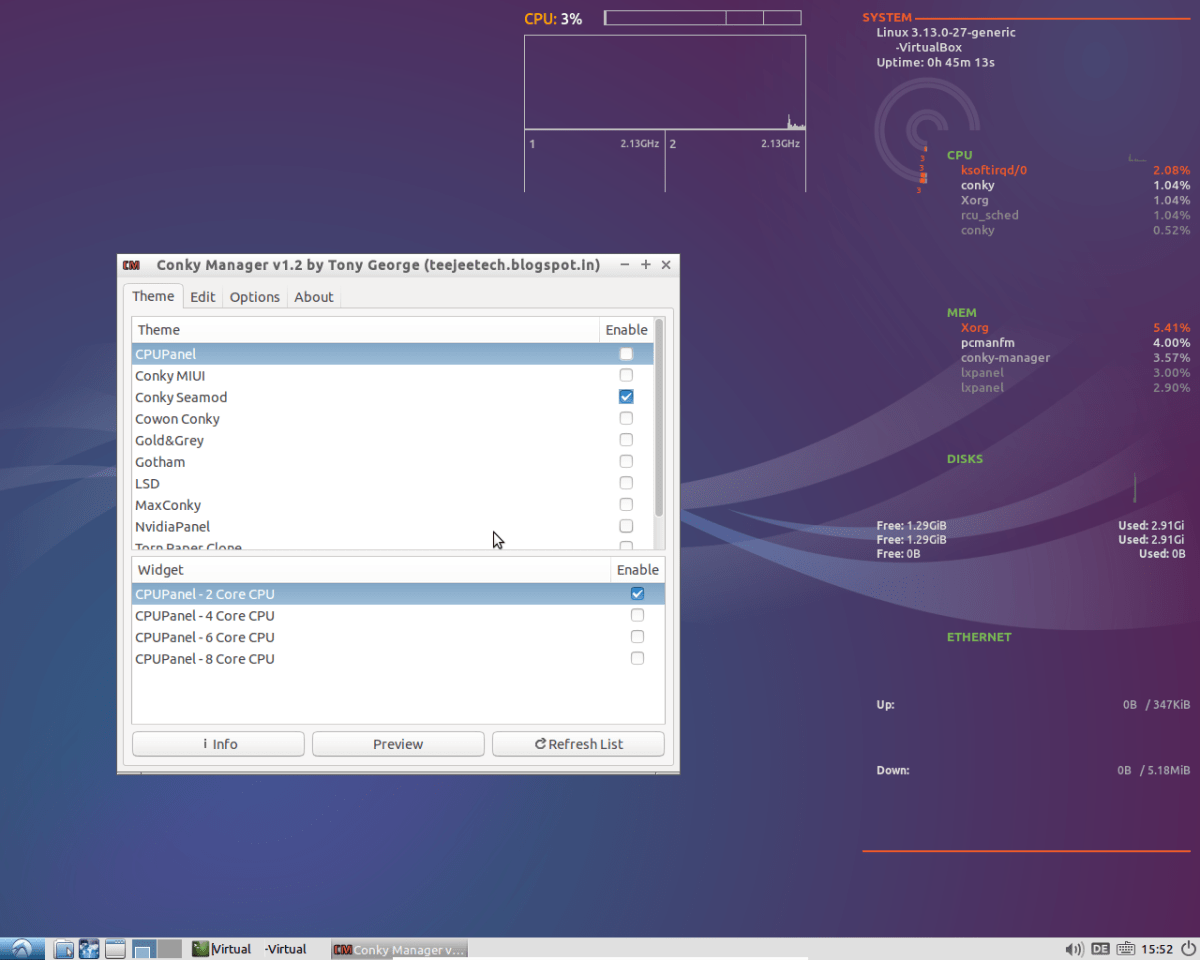
CPU and memory are the lifeblood of any computing system. A system monitor continuously tracks CPU utilization percentage and memory consumption (both RAM and swap). Sustained high CPU usage (above 80%) can indicate inefficient code, background processes, or denial-of-service attacks. Similarly, memory leaks or insufficient RAM can cause swapping, leading to severe performance degradation.
- Monitor per-process CPU and memory usage
- Set thresholds for alerting
- Compare usage over time to detect trends
Tools like htop provide real-time views, but enterprise system monitors offer historical analysis and alerting.
Disk I/O and Storage
Disk performance is often a bottleneck in database-heavy applications. A system monitor tracks read/write operations per second (IOPS), latency, and disk queue length. It also monitors available disk space to prevent outages caused by full drives.
- Track disk usage trends to forecast capacity needs
- Monitor I/O wait times to detect storage bottlenecks
- Alert on disk full conditions before they cause downtime
For example, if a log file grows uncontrollably, a system monitor can trigger an alert before the disk fills up.
Network Performance
Network monitoring is essential for diagnosing connectivity issues, latency, and bandwidth saturation. A system monitor tracks metrics like packet loss, round-trip time (RTT), bandwidth utilization, and TCP connection states.
- Monitor bandwidth usage per interface
- Detect network outages or routing issues
- Identify devices causing high traffic
Using tools like SNMP or NetFlow, system monitors can provide deep visibility into network health.
How to Choose the Right System Monitor
Selecting the right system monitor depends on your environment, budget, and technical requirements. Here’s a structured approach to help you decide.
Assess Your Infrastructure
Start by mapping your IT environment. Are you running on-premises servers, cloud instances, containers, or a hybrid setup? If you’re using Kubernetes, tools like Prometheus and Grafana are ideal. For traditional Windows servers, SolarWinds or Nagios might be better suited.
- List all systems to be monitored (servers, databases, apps)
- Identify deployment models (physical, virtual, cloud)
- Determine scalability needs
A mismatch between your infrastructure and the system monitor can lead to gaps in visibility.
Evaluate Integration Capabilities
The best system monitor integrates seamlessly with your existing tools. Look for support for APIs, webhooks, and popular platforms like Slack, PagerDuty, or Jira. For DevOps teams, CI/CD pipeline integration is crucial.
- Check compatibility with cloud providers
- Verify support for container orchestration (e.g., Kubernetes)
- Ensure logging and alerting can be routed to your incident management system
For instance, Datadog offers over 500 integrations, making it highly adaptable.
Consider Total Cost of Ownership
While open-source tools like Zabbix and Prometheus are free to download, they may require significant time and expertise to set up and maintain. Commercial tools like New Relic or Datadog charge based on hosts or metrics volume, which can add up quickly.
- Factor in licensing, hardware, and staffing costs
- Estimate setup and maintenance effort
- Compare ROI based on downtime reduction and productivity gains
According to Gartner, organizations that invest in comprehensive monitoring see a 30-50% reduction in unplanned outages.
Setting Up Alerts and Notifications
A system monitor is only as good as its alerting system. Without timely notifications, critical issues can go unnoticed until it’s too late.
Defining Effective Alert Thresholds
Setting thresholds too low leads to alert fatigue—too many false positives. Setting them too high means missing real problems. The key is to use dynamic thresholds based on historical baselines.
- Use percentile-based thresholds (e.g., 95th percentile)
- Implement anomaly detection using machine learning
- Avoid alerting on transient spikes unless they persist
For example, instead of alerting on 90% CPU for one minute, set the condition to “CPU > 90% for 5 consecutive minutes.”
Notification Channels and Escalation
Alerts should reach the right people through the right channels. Most system monitors support email, SMS, Slack, Microsoft Teams, and PagerDuty integrations.
- Configure multiple notification methods
- Set up escalation policies (e.g., if no response in 15 mins, notify manager)
- Enable on-call scheduling for 24/7 coverage
Tools like Opsgenie (now part of Atlassian) specialize in intelligent alert routing and on-call management.
“The goal isn’t to eliminate alerts—it’s to make every alert meaningful.” — Site Reliability Engineering, Google
Best Practices for System Monitoring
Even the best tools fail without proper practices. Here are proven strategies to maximize the value of your system monitor.
Monitor End-to-End User Experience
Don’t just monitor servers—monitor what users actually experience. Synthetic monitoring simulates user transactions (e.g., logging in, checking out) to detect issues before real users do. Real-user monitoring (RUM) captures actual browser performance, including page load times and JavaScript errors.
- Use synthetic checks to verify critical workflows
- Integrate RUM to understand frontend performance
- Correlate backend metrics with user experience
New Relic and Datadog offer strong RUM capabilities.
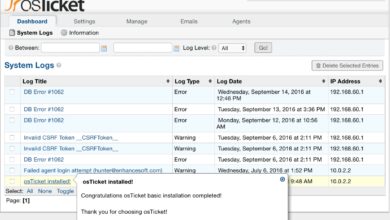
Implement Log Aggregation
Logs are a goldmine of diagnostic information. A system monitor should integrate with a log management solution like ELK Stack (Elasticsearch, Logstash, Kibana) or Splunk to centralize and analyze logs.
- Collect logs from all systems and applications
- Use structured logging (e.g., JSON format)
- Set up log-based alerts for critical errors
For example, a sudden spike in 500 errors in your web server logs can trigger an immediate investigation.
Regularly Review and Tune Monitoring
Monitoring is not a “set it and forget it” task. As your systems evolve, so should your monitoring strategy. Regularly audit your alerts, dashboards, and coverage.
- Conduct monthly monitoring reviews
- Remove stale or redundant alerts
- Add monitoring for new services or features
This ensures your system monitor remains relevant and effective.
Future Trends in System Monitoring
The world of system monitoring is evolving rapidly, driven by cloud computing, AI, and the rise of microservices.
AIOps and Predictive Analytics
AIOps (Artificial Intelligence for IT Operations) is transforming system monitoring by using machine learning to detect anomalies, predict failures, and automate responses. Instead of reacting to alerts, AIOps platforms can identify patterns and suggest root causes before outages occur.
- Predict disk failures based on SMART data trends
- Automatically correlate related alerts to reduce noise
- Recommend configuration changes to optimize performance
Tools like Moogsoft and BigPanda are leading the AIOps revolution.
Observability Over Monitoring
The industry is shifting from traditional monitoring to full observability. While monitoring asks “Is the system up?”, observability asks “Why is it behaving this way?” It combines metrics, logs, and traces to provide deep insight into complex systems.
- Adopt distributed tracing for microservices
- Use open standards like OpenTelemetry
- Enable developer self-service with rich dashboards
As systems grow more complex, observability becomes essential.
What is a system monitor?
A system monitor is a software tool that tracks the performance, availability, and health of computer systems, networks, and applications. It collects metrics like CPU usage, memory, disk I/O, and network traffic to help IT teams detect and resolve issues proactively.
Why do I need a system monitor?
You need a system monitor to prevent downtime, optimize performance, ensure security, and meet compliance requirements. Without it, you risk undetected failures, slow response times, and poor user experience.
Which system monitor is best for beginners?
For beginners, Datadog and Zabbix offer user-friendly interfaces and extensive documentation. Datadog is cloud-based and easy to set up, while Zabbix is open-source and highly customizable.
Can I use a system monitor for cloud environments?
Yes, most modern system monitors like Datadog, New Relic, and Prometheus are designed to work seamlessly with cloud platforms such as AWS, Azure, and Google Cloud, providing full visibility into virtualized and containerized environments.
How does a system monitor improve security?
A system monitor improves security by detecting unusual activity, such as unexpected spikes in network traffic or unauthorized access attempts. It can also monitor system logs for signs of intrusion or malware activity.
In today’s complex IT landscape, a robust system monitor is no longer optional—it’s essential. From preventing costly outages to optimizing performance and enhancing security, the right monitoring strategy empowers organizations to stay ahead of problems. Whether you choose open-source tools like Zabbix and Prometheus or commercial platforms like Datadog and New Relic, the key is consistency, coverage, and continuous improvement. As technology evolves, so too must our approach to monitoring, embracing trends like AIOps and observability to build more resilient and intelligent systems.
Further Reading: